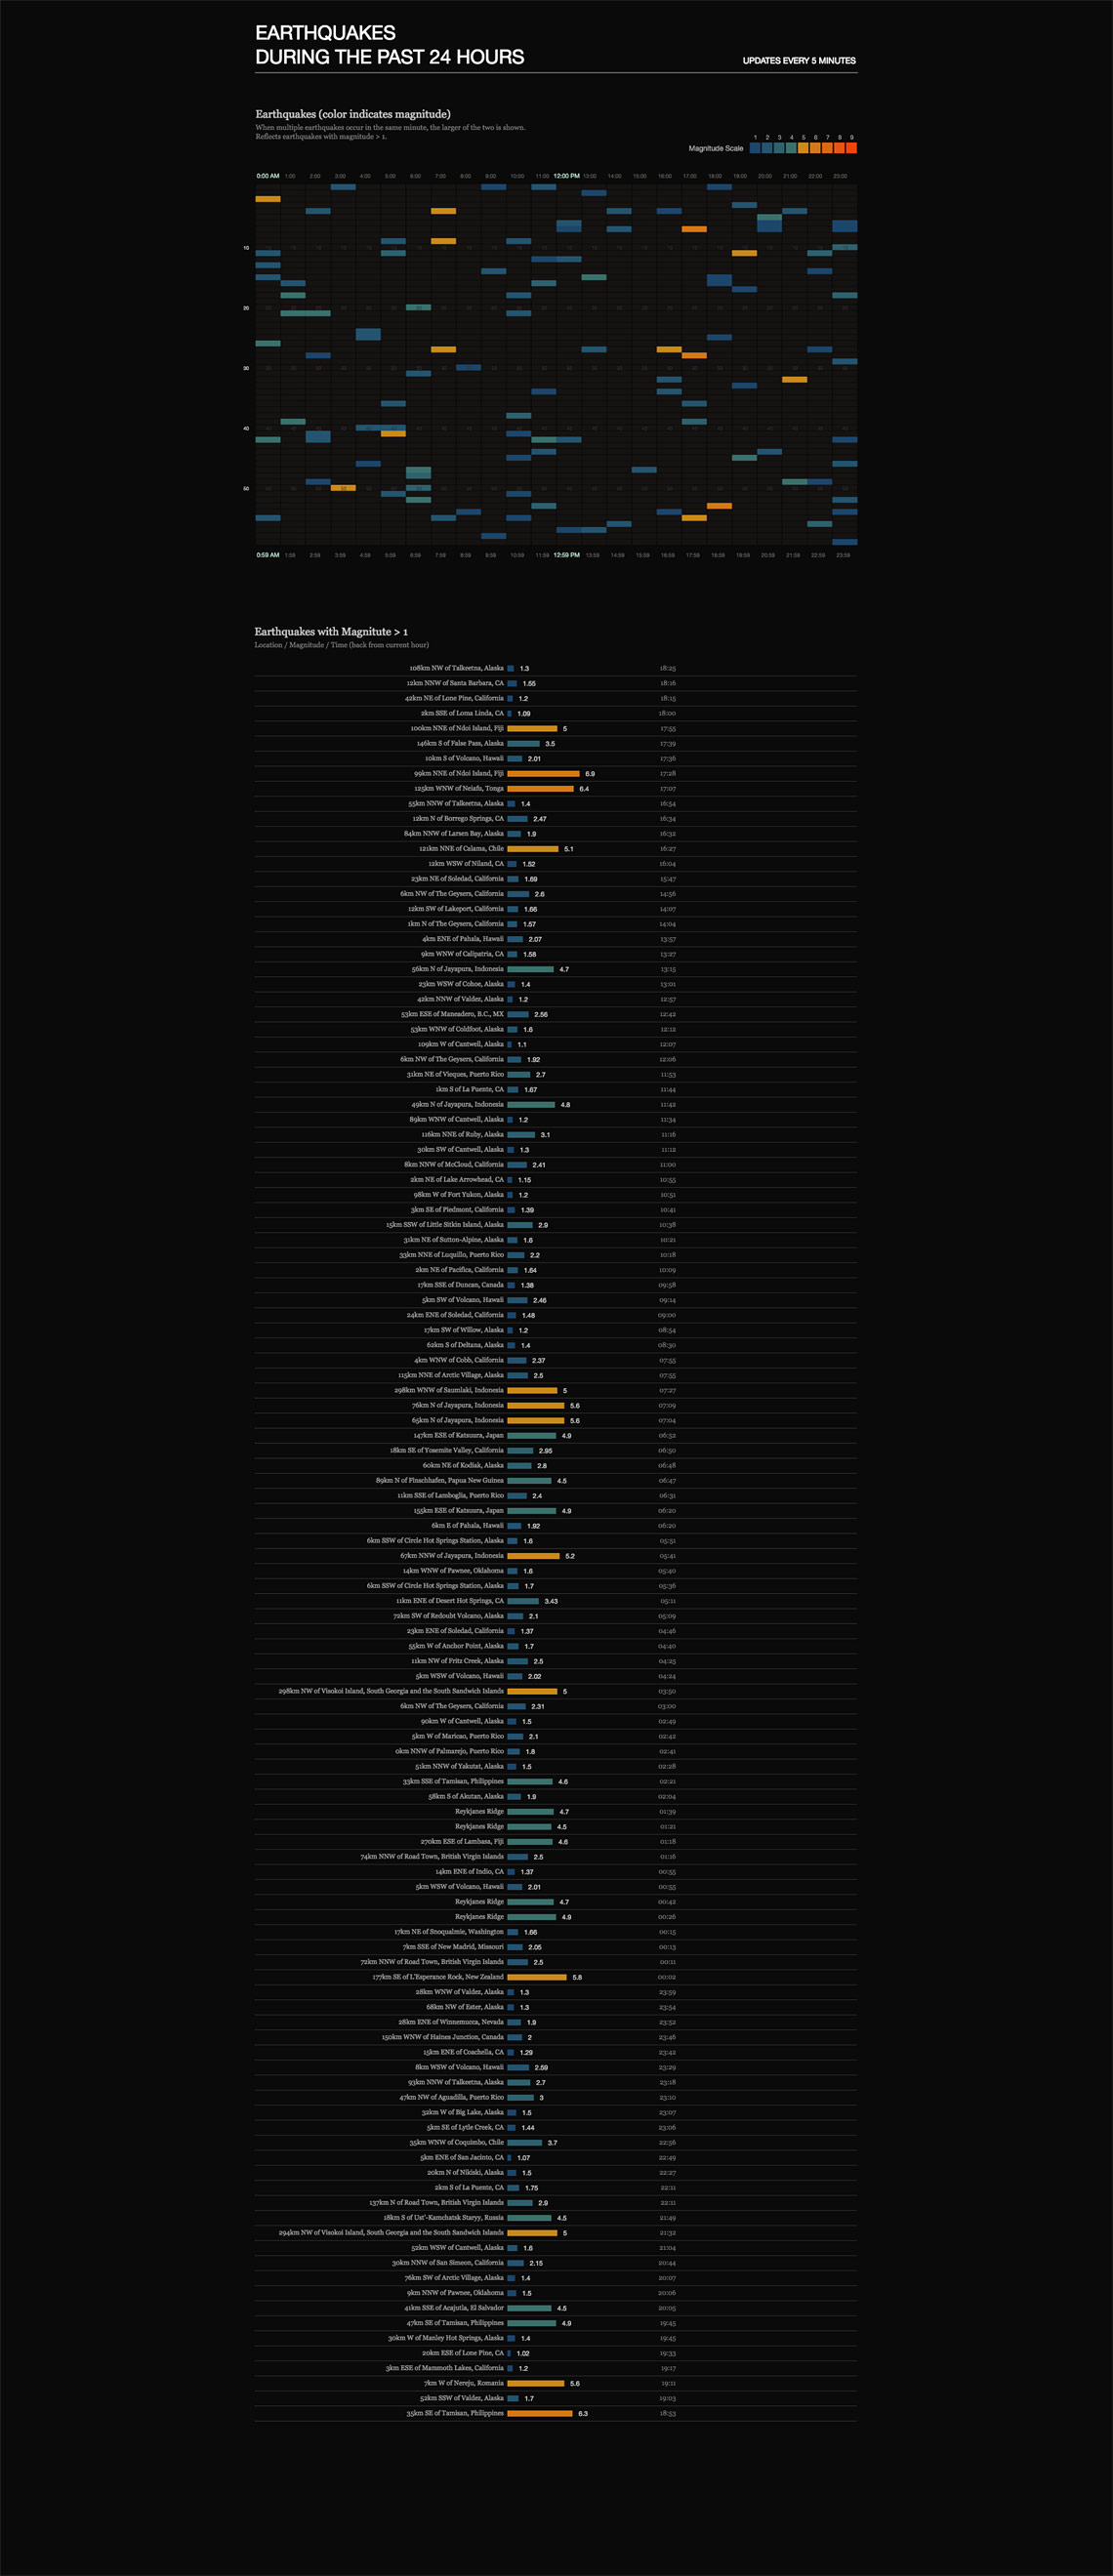
Earthquakes Today
p5.js
CSV [Remote from earthquake.usgs.gov]
My Role in This Project
Position:
Design & Development
Design:
Data Visualization, Information Design
Data:
Remotely loading from earthquake.usgs.gov every 5 minutes
Engineering:
Front-end: p5.js, JavaScript
I have used Processing in the past and wanted to test p5.js's canvas/javascript implementation. I found the experiment quite useful as p5 seems to be very good at drawing custom shapes and quick sketching. However the same interface could be developed at a fraction of the time and with easier programming logic in d3.js. I fiddled with interactivity as well but I am largely unconvinced p5 is the right tool for the job - it is too intensive computationally and cumbersome to keep track of the mouse location and looping on each mouse move to find the data points and trigger the tooltips.
I also wanted to test drive (again) the idea of visualizing time on both the x and y axis. This is a continuation of an experiment with unconventional visualizations that started in this project. I find this one to be more successful than the previous attempt except it is in dire need of an interactive component to aid the reading of the records.